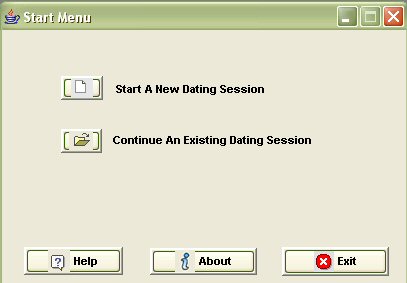
The Start Menu
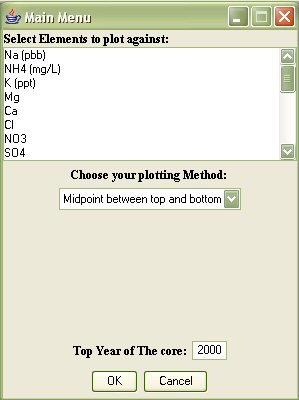
The Main Menu
The subplots with sample years
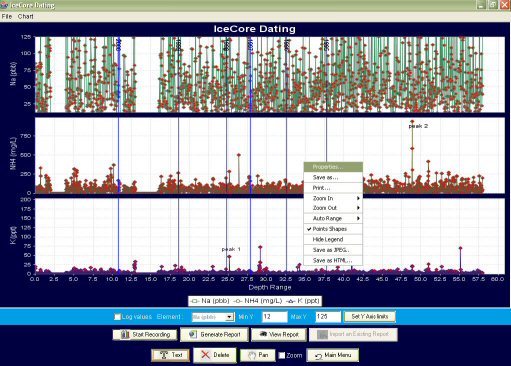
The subplots with shapes enabled and the right context menu displayed
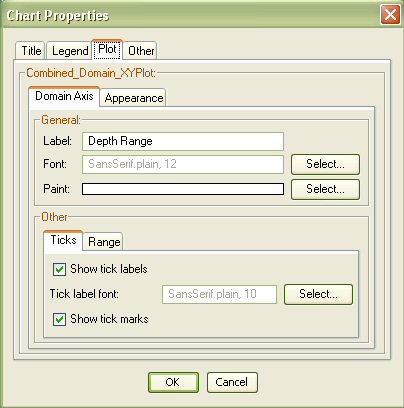
Plot customization menu
Generated report

The Start Menu
The Main Menu
The subplots with shapes enabled and the right context menu displayed
Plot customization menu
Generated report